Friday, October 11, 2013

Thornwood single family market stats through third quarter 2013

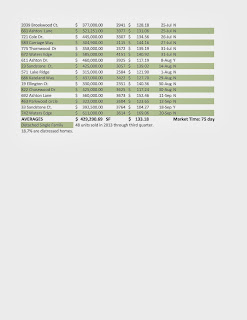
The year is 3/4 over and here are the latest numbers for Thornwood.  Inventory levels reflect a sellers market in this neighborhood with less than 3 month's supply of inventory for both detached and attached single family homes. 


Source MRED MLS. Information deemed reliable but not guaranteed.


Tuesday, July 23, 2013

Promoting the neighborhood of Thornwood in South Elgin, IL


It is easy to find information on individual properties online. But where does a buyer go to find more in-depth information about a community in general? Many buyers decide that they want to live in a specific neighborhood or community before they find the house that they will purchase.
Today's buyer is internet savvy and they search online long before they begin viewing properties in person.

I created this blog about Thornwood in South Elgin Illinois to be that source of information for buyers.

I am reposting links to blogs, both written and video, from popular homesearch websites,  that I have created to provide buyers with a place to find out more information. Please scroll through the archived posts

When the entire neighborhood remains in demand...this is good for all properties in the Thornwood.
So please pass along these links to anyone you know who has mentioned they want to live in Thornwood.

My Thornwood Comments on Zillow. Link to Trulia Blog.

Write me at CindyStrahota@gmail.com or call (or text) 630-624-9246 to find your place in Thornwood.

Monday, July 22, 2013

Townhome Stats added for first half year over year comparison

Added Townhome stats for first half...sorry for the delay! Significant increase in the number of units sold. Click on the image to increase size.

Sunday, July 14, 2013

2012 vs 2013 sales stats compared for first half of the year

Thornwood, South Elgin, IL
Thornwood, South Elgin, IL homes sales stats
Market improvements are evident in Thornwood with positive numbers across the board.  The current month's supply of inventory is 6.5  for detached single family homes.

Townhomes have a greater shortage at 4.8 months of inventory.


Click on image to increase size.

Thursday, June 20, 2013

St. Charles North High School ranked #21 in IL

Once again the schools in district #303, serving the Thornwood community  are recognized for  their excellent education. Read here in the US News and World Report.

usnews and world report ranks IL high schools,


Wednesday, June 19, 2013

Keeping Thornwood streets safer with new speed display signs

Thornwood is a neighborhood with lots of kids, bikes, walkers, etc.  
The  speed limit on Thornwood Drive is 25 miles per hour and these newly posted signs will help drivers to be aware of their speed  and slow down when driving through the community. 

Thursday, April 11, 2013

2013 First Quarter sales and Price/ Square Foot

Average price per square foot rises for first quarter sales in Thornwood in South Elgin, IL. Twelve sales of single family homes occurred during first quarter of 2013 and three of those were distressed sales. 

Source is MRED mls.

Tuesday, April 2, 2013

Tuesday, March 5, 2013

Average $/SF for Thornwood is $113.66 for second half 2012

Price per square foot lower for second half due to more short sales. 23% of second half sales are short sales.

Wednesday, February 27, 2013

Significant increase in home sales in Thornwood

Year over Year sales for Thornwood, South Elgin, IL 

Monday, February 18, 2013

Thornwood compares favorably to Kane County overall

Demand for housing inventory in  Thornwood is higher than Kane County and surrounding communities.

Thornwood currently has 5.8 months supply of inventory for detached single family homes and 3.4 months supply of inventory for town homes.

Compare that to Kane County  where there is an overall 10.7 months supply of housing. this is a significant difference and it is evidence that Thornwood is in high demand.

I track inventory levels for the Fox Valley communities at my blog:

Monday, January 14, 2013

Number of Distressed Sales lower in Thornwood than Kane County


In Kane County 49% of all residential sales occurring in 2012 were distressed sales. However, properties in Thornwood fared better than Kane county with 34.6% of all residential sales being of a distressed nature.  If only single family detached homes are considered, 22.6% of the single family homes in Thornwood were distressed sales. A distressed sale is a bank owned (foreclosure), a short sale, a court or auction sale.

Inventory levels in Thornwood are significantly below the surrounding communities with Thornwood having 3.6 month of inventory of detached SF homes and Kane County having 7.9 months supply.

Check out  my blog where I post monthly inventory levels for several Fox Valley communities.


Information obtained from MRED MLS and deemed reliable.

Friday, January 4, 2013

2012 Housing Statistics for Thornwood


Here is a summary of 2012 statistics 
for the single family detached homes in the  
Thornwood neighborhood in South Elgin, Illinois.


  •  61  Single Family Homes sold in Thornwood with an average marketing time of  96  days.
  • $365,000   Median home price.
  • $388,390    Average home price.
  • $ 690,000   Highest price home sale.
  • $ 225,000   Lowest price home sale.

18  homes did not sell because they expired or cancelled. The sold price as a percentage of  list price is 96% and  the sold price as a percentage of ORIGINAL list price is 93 %  (Price was reduced) .

Market improvements noted are a 65%  increase in the number of single family homes sold. The marketing time decreased from 196 average days on market to only 96 average days on market.
However, the average home price for 2012 of $388,390 is 2% lower than in 2011 while the median home price remained at $365,000.

Conclusion is that more homes sold more quickly at slightly lower prices in 2012 than in 2011 in Thornwood.